Cost per conversion
An install from search cost 2.5 times less.
MobiDB by Enterra | Android and Windows 10 | September 2014 to March 2015
The client set hard ceilings on what a click and a conversion could cost.
MobiDB lets people build relational databases on Android and Windows 10 for anything from CD and DVD collections to recipes, sales, and costs. It is made by Enterra, a custom software developer.
The goal was more installs at the lowest possible cost per click and per conversion: at most $0.40 per click and $0.90 per conversion.
Mobile and tablet users could install from Google Play, while desktop users had to reach the app through landing pages, so the traffic needed separate campaigns.
Advertising started on September 25, 2014. The results were taken on March 16, 2015.
Search queries were analyzed and selected, then expanded with both exact and broader keywords to win more conversions.
Unique ads were written and produced in different formats for different device types.
Search and display ran as separate campaigns. Two sent mobile and tablet traffic to Google Play, and two sent desktop traffic to landing pages.
Display ad groups targeted other apps and app categories, keywords, placements, and user interests, with text, image, and video ads.
Bids were adjusted by device and location, and ads and extensions were tested and updated.
Monthly Google Ads data for the search campaign in September 2014 and March 2015.
An install from search cost 2.5 times less.
The average click got 1.74 times cheaper and stayed under the $0.40 cap.
Ad CTR grew about 1.5 times as keywords and ads were refined.
A larger share of clicks turned into installs.
September was a partial month: advertising started on September 25. The display campaign reached its targets in the first months, with a conversion rate of 6 to 10%. Full monthly tables are below.
Changing the average ad position:
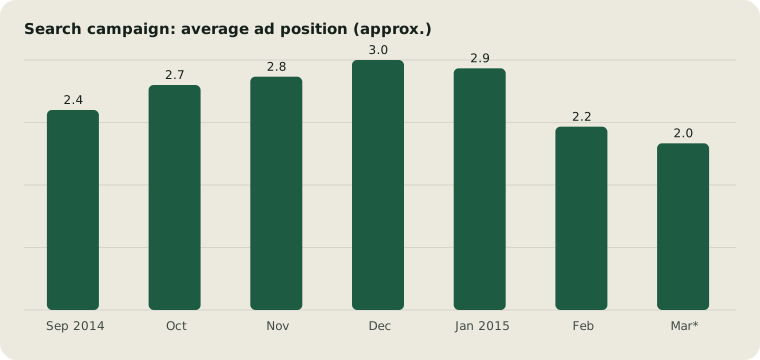
Average ad position in the search campaign (1 is the top slot), approximate values read from the original Google Ads chart. March is a partial month in that chart.
Search campaign results:
| Month | Clicks | CTR, % | Price per click, $ | Achieved goals | Price per conversion, $ | Conversion ratio, % |
|---|---|---|---|---|---|---|
| Sept. | 13 | 5.24 | 0.47 | 2 | 3.06 | 15.38 |
| Oct. | 68 | 5.23 | 0.43 | 16 | 1.84 | 23.53 |
| Nov. | 66 | 4.50 | 0.25 | 22 | 0.76 | 33.33 |
| Dec. | 82 | 5.12 | 0.27 | 25 | 0.88 | 30.49 |
| Jan. | 105 | 4.45 | 0.26 | 29 | 0.94 | 27.62 |
| Feb. | 256 | 7.77 | 0.31 | 54 | 1.48 | 21.09 |
| Mar. | 420 | 7.62 | 0.27 | 93 | 1.23 | 22.14 |
We added new keywords (both targeted and broader ones) to increase conversions, and we also increased the bids. This has led to an improvement in the positioning of the ads and an increase in the number of clicks and conversions (i.e., application downloads) with an acceptable increase in the cost per conversion.
For the display network we developed an advertising campaign that included various types of targeting (based on interests, other applications, and categories of users) and ads (textual, image, and video ads). Thus, we covered our target audience to the maximum degree possible. The conversion rate for the display network campaign was in the range of 6 to 10%.
Display network campaign results:
| Month | Сlicks | Price per click, $ | Achieved goals | Price per conversion, $ | Conversion ratio, % |
|---|---|---|---|---|---|
| Sept. | 0 | 0 | 0 | 0 | 0 |
| Oct. | 2705 | 0.03 | 178 | 0.52 | 6.58% |
| Nov. | 1868 | 0.08 | 180 | 0.84 | 9.64% |
| Deс. | 2023 | 0.08 | 210 | 0.72 | 10.38% |
| Jan. | 2130 | 0.07 | 196 | 0.77 | 9.20% |
| Feb. | 2281 | 0.07 | 207 | 0.73 | 9.07% |
| Mar. | 3001 | 0.05 | 214 | 0.69 | 7.13% |
During the period under analysis the number of app installations rose to 300 per month as a result of PPC for app, and ad CTR grew 1.5 times. In addition, the conversion rate improved and the cost per conversion decreased.
The cost per click for the search campaign declined 1.74 times, and the cost per conversion fell 2.5 times.
The costs per click and conversion declined for the media network campaign, while at the same time the number of conversions increased. We were able to achieve the target indicators for the display network campaign during the initial months of advertising.
«We were happy to work with Alconost. They performed ongoing work to optimize our ad campaigns (adding new keywords, refining target groups, adding new types of ads, etc.). As a result, the number of clicks increased and CPC decreased. On the other hand, it must be said that mobile app promotions do not always immediately pay off. Given an average price of $0.70 per application installation (and consider that $1.00-1.50 is regarded as a good indicator for the average price paid per application installation for paid promotions) and the number of users that we have been able to convert from the free version of the app to the paid version, we have still not been able to recoup the costs of this type of promotion. When the installation price drops to $0.50, we will be able to say that we are completely happy with the campaign results. In the meantime, we are pleased that there is a downward price trend for cost per installation.»
Yekaterina Nebogina
Enterra Inc.
Originally published on the Alconost Digital blog. Onlinuum is run by the former Alconost Digital team.
Other engagements where we improved paid search performance.

How ALVADI scaled Google Ads across five languages for automotive e-commerce, reaching 2.4x revenue and 2.2x conversion rate. Read the case study.

How Bamboo Group launched PPC landing pages for a narrow B2B offer, hitting a 4.22% conversion rate and $9.89 CPA within days. Read the case study.

Search ads for a DLNA media server: in three months, monthly conversions grew from 10 to 82 and cost per conversion fell from $20.53 to $4.83.
Search and display campaigns for a database app grew installs to 300 a month in about six months, lifted CTR 1.5 times and cut search CPC 1.74 times.
PPC for a Supreme drop-buying app entering the US and Europe: 34% of all season purchases, 483% ROI in three months and a 52% impression share.
Search and display ads for a tour agency: Montenegro search CTR rose from 11% to 24.5% in a year, with clicks at $0.04-0.06, below the regional average.
We connect paid user acquisition, ASO and store page conversion for iOS and Android apps, with native specialists for each language.